Content ROI & B2B Lead Generation
How to Measure Content Marketing ROI and Defend the Blog Budget

A blog budget survives the meeting when three numbers line up: organic sessions attributed to specific articles, the conversion paths where those articles appear before a demo or trial, and the cost per published article set against the cost per lead from your paid channels. This guide shows how to assemble those numbers from data you already have, and how to present them without claiming a causation you cannot prove.
You have a quarterly review in two weeks. Someone will ask what the blog produced. The honest answer — “website traffic went up” — is the weakest possible answer, because traffic alone does not pay anyone’s salary, and the person asking knows it.
The problem is rarely that the blog failed. The problem is that the reporting was never built to answer a finance question. Most teams track sessions at the property level, which tells you the site grew but not which content did the work. They track last-click conversions, which credits the branded search or the pricing page and erases every article that built the intent. And they never calculate what a published article actually costs, so there is no denominator to compare against the cost per lead of paid search.
This guide is the operational fix. You will set up article-level attribution for organic sessions, trace the conversion paths where blog content appears before a demo or trial signup, calculate a defensible cost per lead from content, and assemble all of it into a one-page report a CFO can read in ninety seconds. The broader case for why a company blog earns its place is covered in the pillar on content marketing ROI and how a company blog turns into traffic, leads and revenue — here we assume you already believe it and need to prove it to someone who does not.
Contents
- What you need in place before you can measure anything
- How to attribute website traffic to individual articles
- How to track the path from blog reader to demo request
- How to calculate cost per lead from content and compare it fairly
- How to present the report without over-claiming causation
- Common mistakes that sink an otherwise good report
- What a defensible content report actually changes
What you need in place before you can measure anything
Three prerequisites. Without them, every number you present will be challenged and you will lose the room.
Analytics configured for landing pages, not just sessions
You need a view of organic entrances by landing page URL, not aggregate organic sessions. The distinction matters: aggregate sessions tell you the site is growing; landing page data tells you that a specific article brought a specific number of people in from search. The article URL is the unit of analysis for everything that follows.
Make sure your analytics and your search console data are both connected and that you can export landing-page-level rows for a date range. If your blog sits on a subdomain or a separate property, fix that first — split tracking produces split arguments.
Conversion events that fire on things the business cares about
A conversion is a demo request, a trial signup, a pricing page view that leads to contact, a quote request. Newsletter signups count only if your sales team actually works that list. Define the events, name them clearly, and make sure they have been firing consistently for at least one full quarter. Three months of clean data beats a year of messy data, because every anomaly you have to explain costs you credibility in the meeting.
A cost number for content production
You cannot calculate return without cost. Add up everything that goes into publishing: writer time, editorial review, images, the tools you pay for, and the share of a manager’s salary spent coordinating it. Divide by articles published. If you want a worked example of how those figures come together for an in-house hire versus other arrangements, the analysis of what a company copywriter costs walks through the arithmetic.
Takeaway: spend the first week fixing measurement, not building slides. A beautiful report on broken data is a liability.
How to attribute website traffic to individual articles
This is the step most teams skip, and it is the one that changes the conversation from “the blog” as an abstract line item to a portfolio of assets with individual performance.
Pull organic entrances by landing page
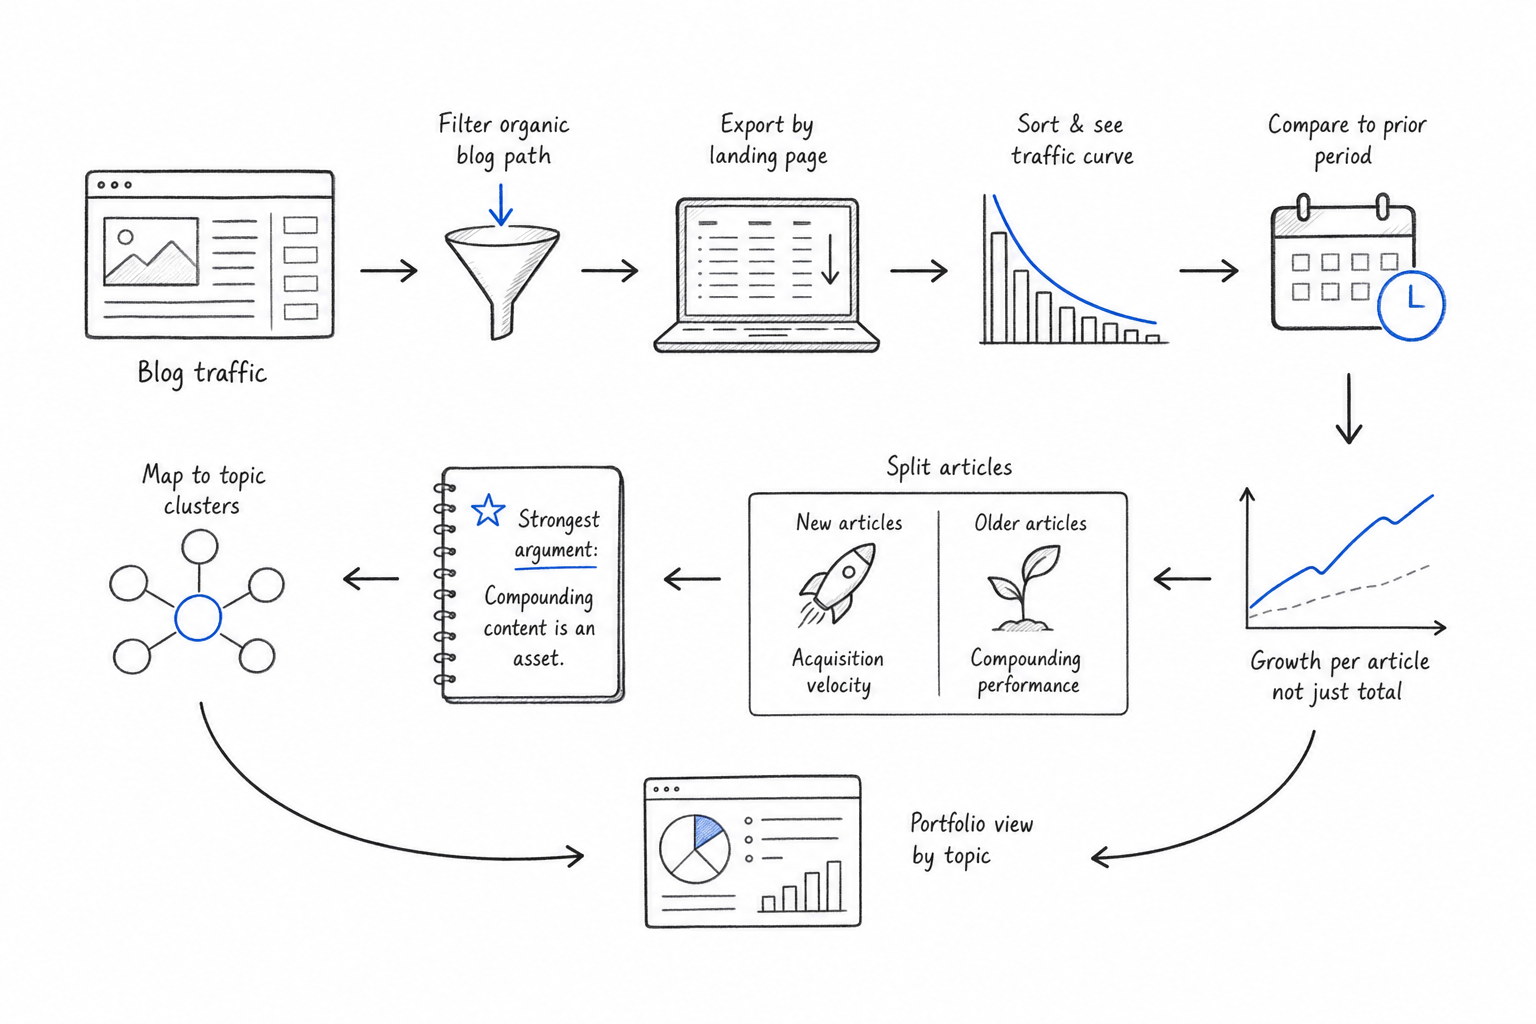
Export organic sessions by landing page for the quarter, filtered to your blog path. Sort descending. You will almost always find a steep curve: a handful of articles carrying a large share of the traffic, a middle band performing modestly, and a long tail doing very little. That shape is normal and it is useful — it tells you where the topic demand actually sits.
Then compare the same period a year earlier, or the previous quarter if the blog is young. Growth per article matters more than total growth, because total growth can come simply from publishing more. A rising average per article means the content is getting better or the topic authority is compounding.
Separate new articles from compounding ones
Split the list into articles published inside the reporting period and articles published before it. The first group shows acquisition velocity: how fast new content starts earning website traffic. The second shows compounding: whether old articles keep working without further investment.
That second number is the strongest argument you have. Paid media stops the day the budget stops. An article published eighteen months ago that still brings qualified visitors is an asset on the balance sheet, even if accounting does not treat it as one. Say exactly that in the meeting.
Map articles to topic clusters, not to random themes
Individual article performance is noisy. Cluster performance is signal. Group your URLs by the topic they belong to and look at the aggregate: a cluster where a pillar and its supporting articles all rank is evidence of topic authority, while scattered posts that each rank for one query are evidence of luck. The mechanics of why structured clusters outperform isolated posts are covered in the piece on why random blog posts rarely rank.
Takeaway: present traffic as a portfolio with a structure, not as one line going up. It reframes the blog as infrastructure.
How to track the path from blog reader to demo request
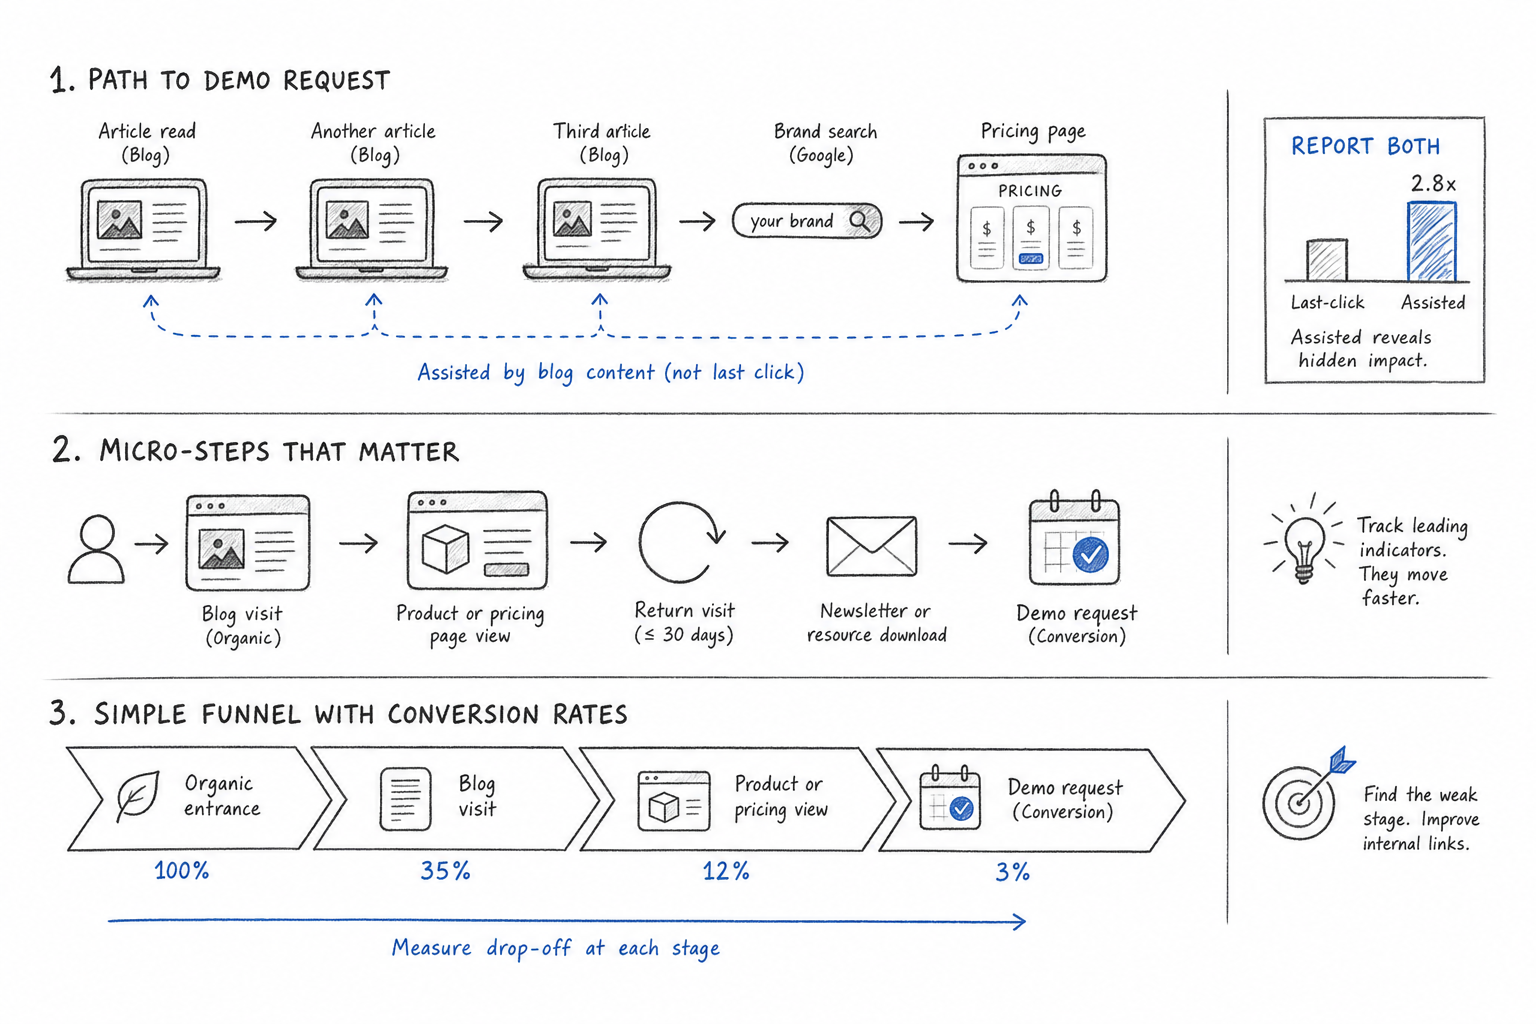
Last-click attribution is the reason blogs lose budget. Someone reads four articles over three weeks, searches your brand name, lands on the pricing page, books a demo — and the report credits brand search. The articles that created the intent get nothing.
Use assisted conversions as your primary lens
An assisted conversion is one where a page appeared somewhere in the user’s path before the converting step, without being the final touch. Most analytics platforms expose a path or attribution report that shows this. Filter it to your blog URLs and you will see which articles appear repeatedly in the journeys that end in a demo.
Report this number alongside last-click, never instead of it. Showing both demonstrates that you understand the limits of your own data, which is precisely what makes a skeptical finance person trust the rest of your slide.
Count the micro-steps between reading and converting
Not every visitor converts in one session, and demanding that they do sets the blog up to fail. Track the intermediate steps: blog readers who then view a product or pricing page, readers who return within thirty days, readers who trigger a newsletter or resource download. These are leading indicators, and they move faster than closed deals.
A practical framing is a simple funnel from organic entrance to product-page view to conversion event, measured as a percentage at each stage. When one stage is weak, you know where to intervene — usually in the internal linking between informational content and the pages that sell. The detailed version of that journey is unpacked in the guide on turning a blog reader into a demo request.
Ask the lead where they came from
Self-reported attribution — a single open field on the demo form asking how the person found you — catches what analytics loses: the article shared in a Slack channel, the answer read inside an AI assistant, the recommendation from a colleague who read you last year. It is imperfect and the sample is small, but it is qualitative evidence that no cookie policy can erase, and it often surfaces content you would never have credited.
Takeaway: build the attribution story on three legs — last-click, assisted paths, self-reported source. One leg always wobbles; three stand.
How to calculate cost per lead from content and compare it fairly
Now the finance part. Two numbers do the work here: cost per published article and cost per lead from content.
Cost per published article is total content spend for the period divided by articles published. If your fully loaded content operation costs a known amount per quarter and you published a known number of pieces, the division is trivial and the number is yours — the reader of your report can verify the arithmetic on the spot. That transparency is the point.
Cost per lead from content is total content spend divided by the leads where content appeared in the path. Note the denominator: leads assisted by content, not only leads where an article was the last touch. State that choice explicitly in a footnote. If you hide the methodology, someone will find it and your whole slide collapses.
Then compare against paid. Take the cost per lead from your search or social campaigns for the same period and put the two side by side. Add one crucial caveat out loud: paid stops when you stop paying; content keeps running. A content lead that costs the same as a paid lead today will cost less over a two-year horizon, because the asset keeps producing. If the specific organic-versus-paid cost comparison is the angle your leadership cares about most, that deserves its own dedicated analysis rather than a footnote in your quarterly deck.
One more number worth adding: cost per article against lifetime sessions rather than quarterly sessions. An article that cost a few hundred euros to produce and has delivered thousands of visits over two years has a unit economics story that no campaign can match.
Takeaway: show the arithmetic, name the assumptions, and let the numbers be checked. Checkable numbers survive meetings.
How to present the report without over-claiming causation
The fastest way to lose a budget argument is to claim more than your data supports. Someone in the room will find the hole, and from that moment every number you presented becomes suspect.
Separate what you measured from what you infer
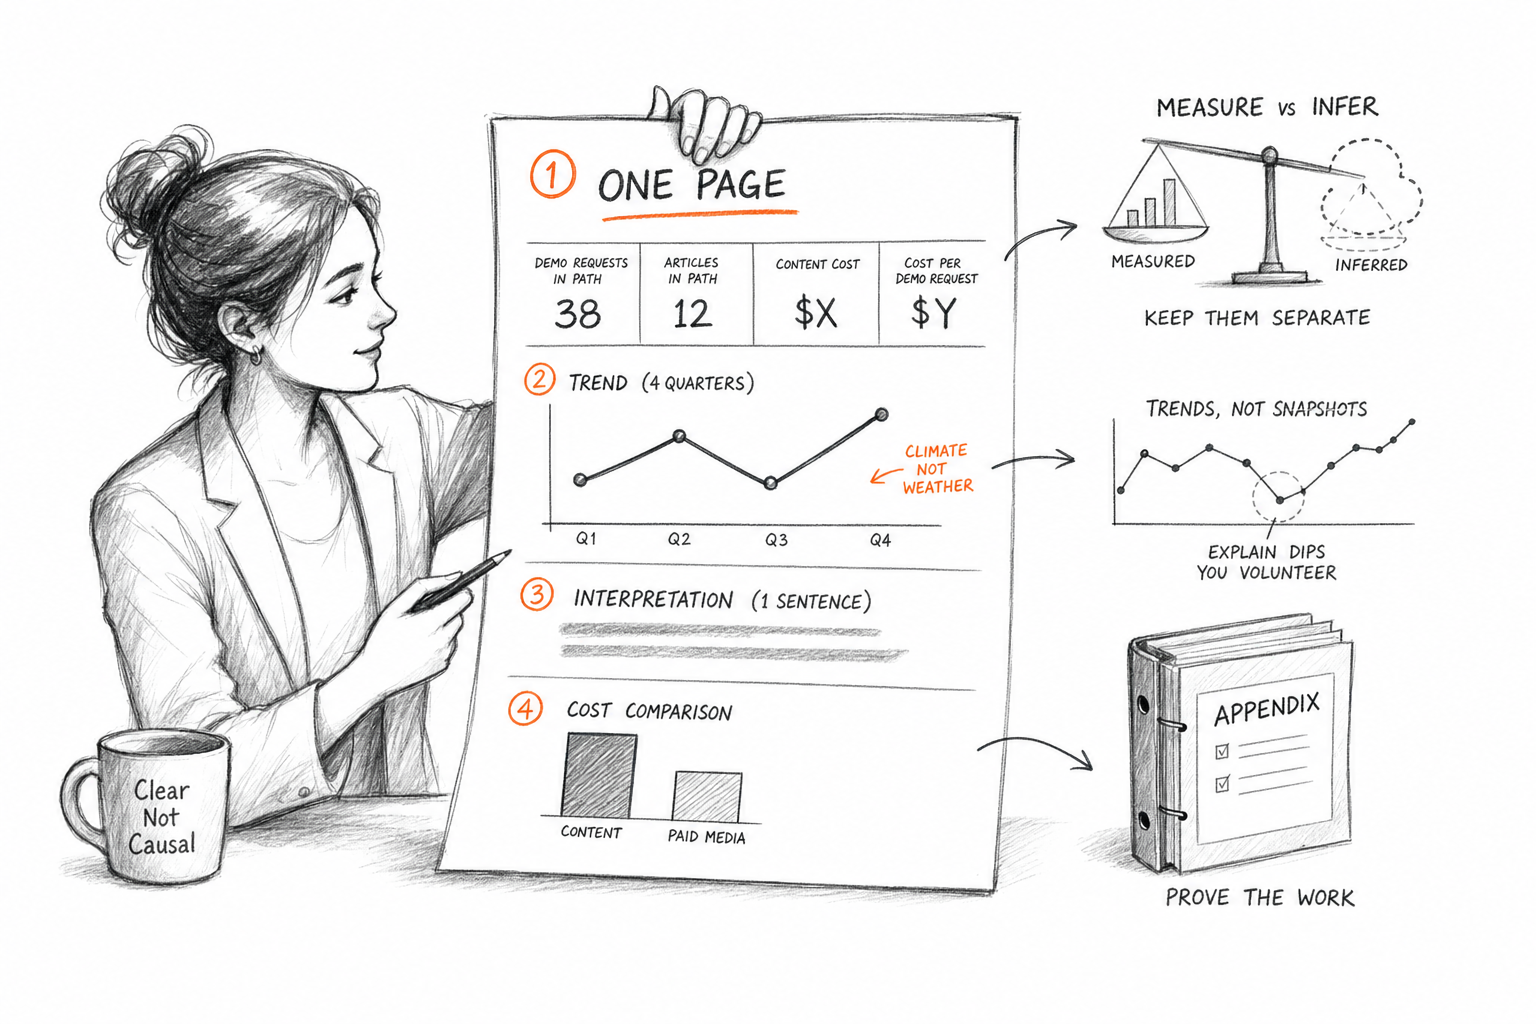
Say “these twelve articles were present in the path of 38 demo requests” rather than “these articles generated 38 demos”. The first is a measurement. The second is an inference, and a contestable one. Make the inference separately and label it: “we believe content contributed meaningfully to these deals, based on assisted path data and self-reported sourcing.”
Marketing managers who distinguish measurement from interpretation get believed on both. Those who blur them get believed on neither.
Use trends, not single-period snapshots
One quarter is weather. Four quarters is climate. Always show the time series, and show it even when a period dipped — seasonality, an algorithm update, a publishing gap. Explaining a dip you volunteered is a strength; explaining one someone else spotted is a defeat.
Keep the report to one page
Executives read one page. Give them the headline numbers, the trend, the cost comparison, and one sentence of interpretation. Put everything else in an appendix nobody will open, but which proves you did the work when challenged.
Here is a workable structure for that single page.
| Metric | What it shows | How to state it |
|---|---|---|
| Organic sessions by article | Which assets earn website traffic | Top performers plus quarter-on-quarter change |
| Sessions from pre-period articles | Compounding value of past spend | Share of total organic from older content |
| Assisted conversions | Content’s role in the demo path | Count, with last-click shown alongside |
| Cost per published article | Unit cost of the asset | Total spend divided by articles published |
| Cost per content-assisted lead | Efficiency versus other channels | Compared to paid, with the durability caveat |
| Publishing cadence held | Operational reliability | Articles per week, including gaps |
That last row surprises people, and it belongs there. Cadence is the variable most under your control and the one that predicts the rest. A blog that publishes at least three articles a week, without gaps, builds topic coverage fast enough to compete; one that publishes monthly is accumulating coverage too slowly for the results to show inside a budget cycle. When leadership asks what you would do with more budget, the answer is not “better articles” — it is “the same quality, three times a week, held for a year.” Consistency compounds; bursts do not.
Takeaway: one page, measured claims, visible arithmetic, and a cadence number that explains everything else.
Common mistakes that sink an otherwise good report
Reporting total sessions without a landing-page breakdown invites the question you cannot answer. Using last-click only hands credit to brand search and makes the blog look useless. Mixing in social and referral traffic when the argument is about search muddies the channel story. Promising a revenue figure you derived from a conversion rate assumption nobody agreed to will end badly the first time a finance team models it independently.
And the quietest mistake: reporting only on the current quarter’s publications. The compounding articles are the asset, and they are the reason the investment makes sense at all. Leaving them out of the report means arguing for a cost instead of an investment.
What a defensible content report actually changes
The numbers rarely change a mind on their own. What changes a mind is the shift from “the blog” as a vague activity to a portfolio of measurable assets with a known unit cost, a known contribution to pipeline, and a known rate of production. Once leadership can see the cost per article and the share of demos touched by content, the conversation moves from whether to fund the blog to how fast it should publish — which is the conversation you wanted.
If sustaining that cadence is the real constraint, that is a production problem, not a strategy problem. See how the plans are priced and work out what a structured, consistently published blog costs against the cost per lead you just calculated.
This article was produced and published automatically with the help of artificial intelligence.
Start today
A blog like this, on your site
This article was written and published by RankGrove, with the method you read about on the site. Try it free on your WordPress: the first article lands in your drafts within ten minutes.
Start free trial